about The Tides - the Netherlands
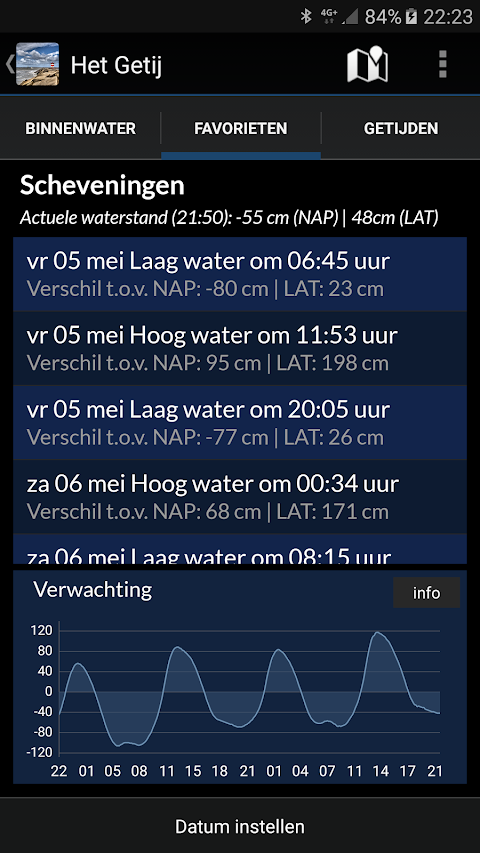
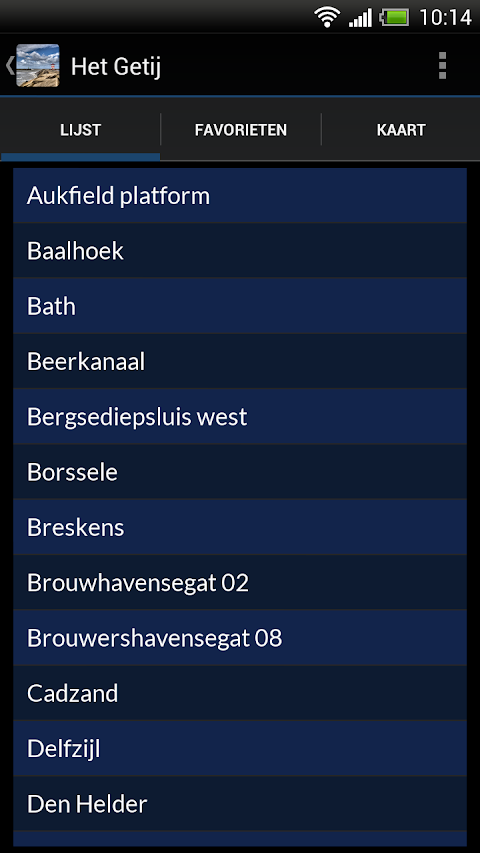
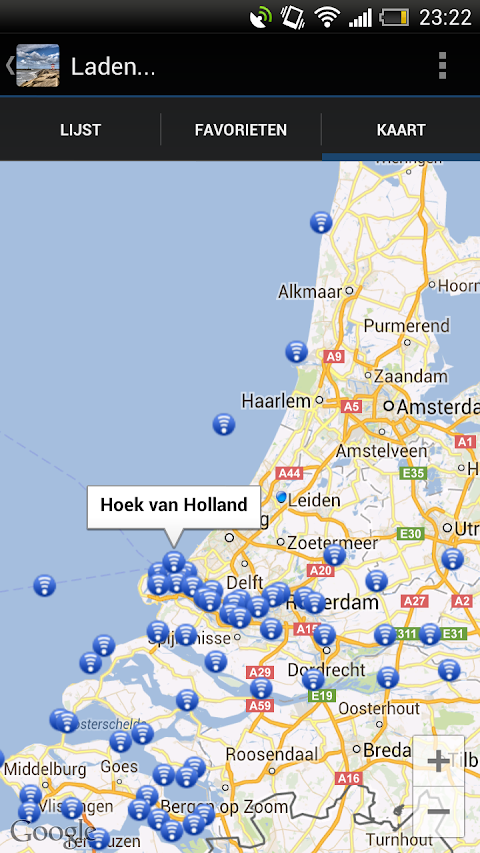
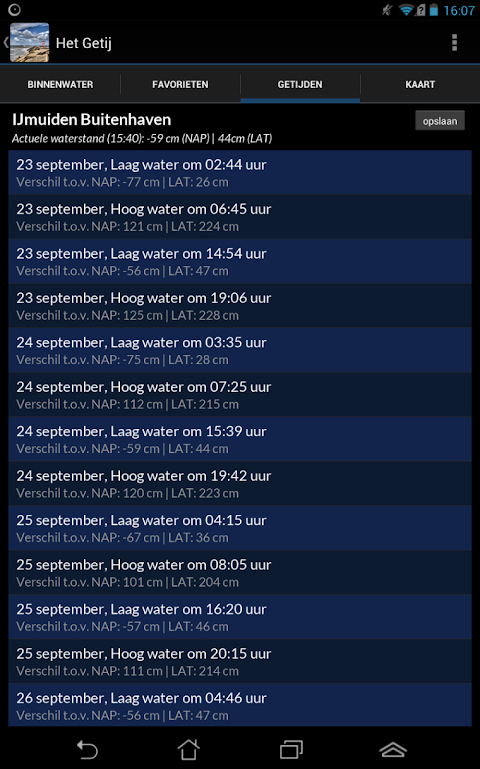
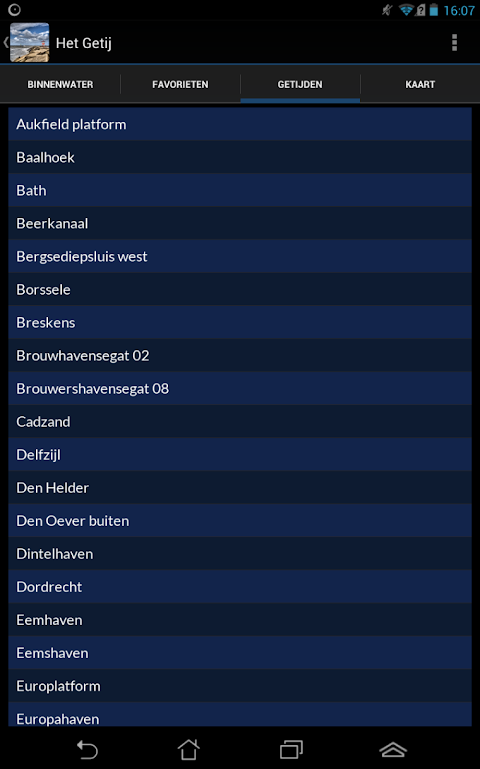
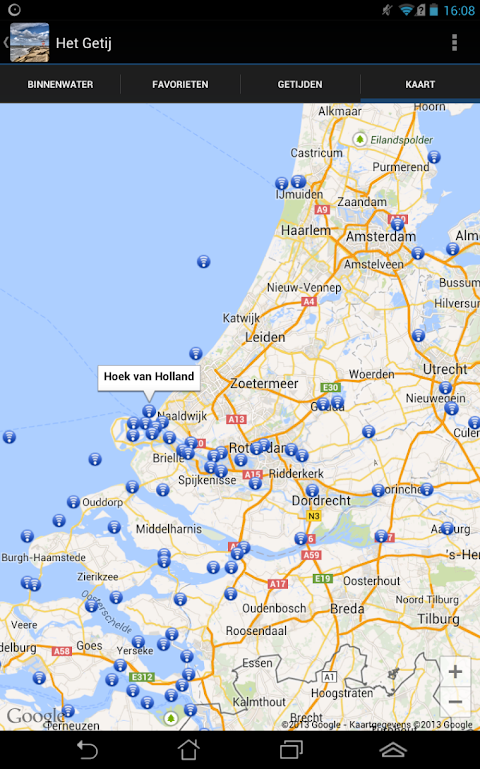
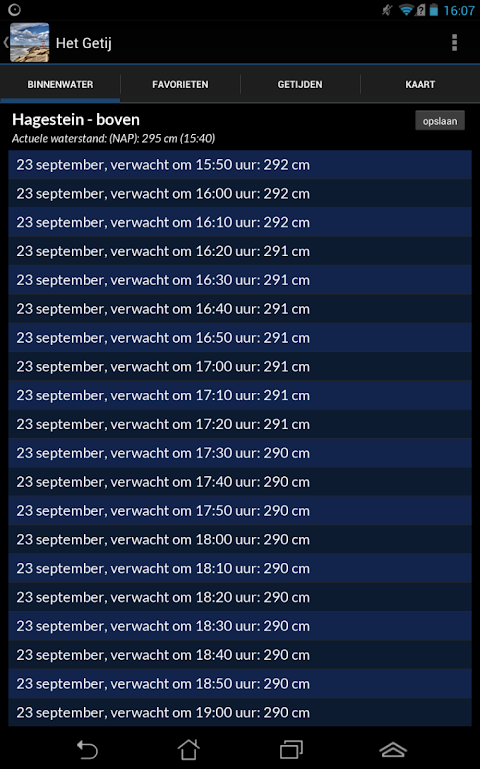
The Tide shows you the astronomical tide forecast and the current water level measurements at all 207 measuring points of Rijkswaterstaat, both in the list and on the interactive map, for the whole of 2019 and 2020.
The graph with the tidal curve shows the expected water level + setup.
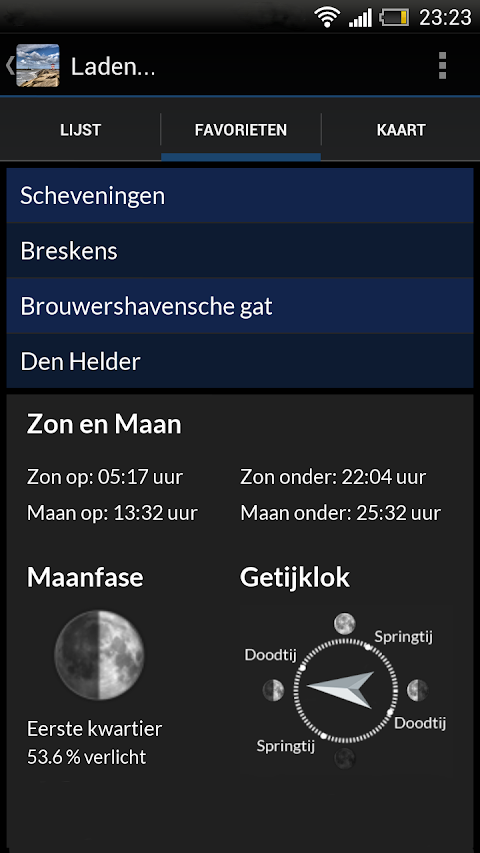
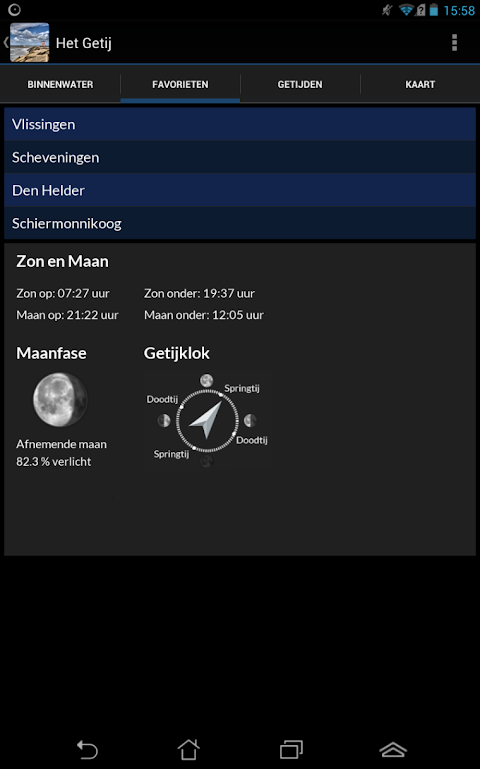
You can add your favorite tide locations to your preferred list, so you get a super fast overview at the start of the app.
Via the handy tidal clock on the home page you can see exactly when the tide is near Spring or Neap. In addition, the app shows the current moon phases and illumination percentages. And of course the sun and moon rise and set times.
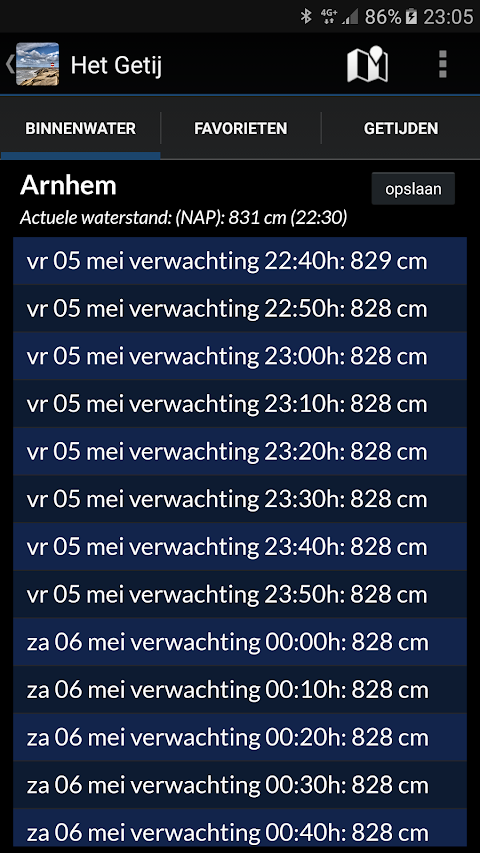
The Getij shows the water levels at tidal locations as well as live water levels and water level expectations in the major rivers, IJsselmeer and Scheldt, up to Antwerp.
The measured values are displayed in NAP and LAT and where applicable in MSL (Mean Sea Level) and come directly from the Rijkswaterstaat database.
Conditions.
We do our utmost to deliver a fantastic and accurate tide app, but of course we cannot guarantee that the software and the data presented therein will always work and are 100% correct. Data sources can sometimes change and you cannot derive any rights from this tide app or the information presented therein. By downloading and using Het Getij you accept these terms and conditions.
Location
The location permission is only needed to show you the current water levels in your area. Surfcheck does not use this location data in any other way.

