about GeoGebra Graphing Calculator
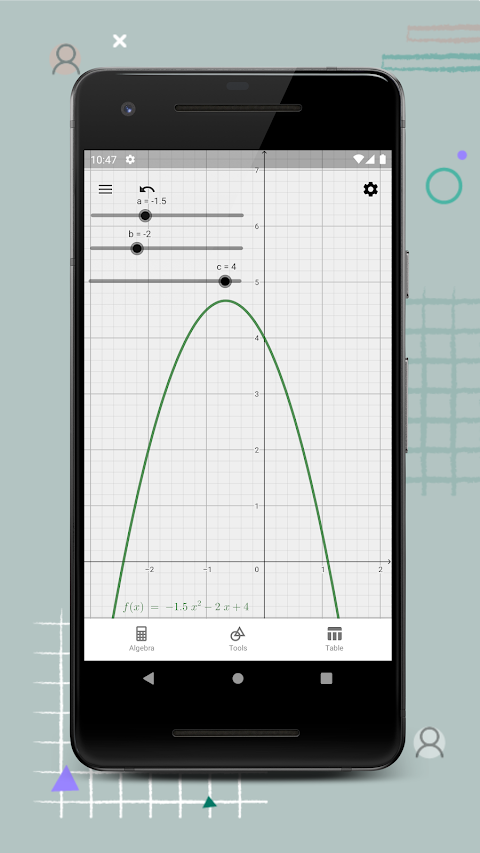
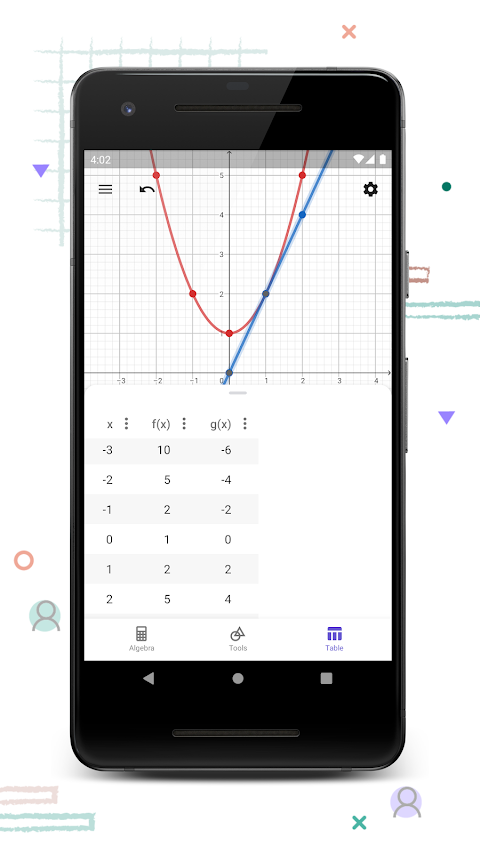
GeoGebra Graphing Calculator is a graphing software to help learn math. app can easily graph functions and equations so you don't have to graph functions by hand. graphing calculator online is very easy to use, and you can save and share it after graphing. Unlike hand-drawn graphs, the math graphs on the app can transform their horizontal and vertical coordinates. Users are able to adjust the different positions of the function, which can be used to bring in and understand the equation. You can also create three-dimensional shapes and rotate them directly to observe their multiple sides. Create markers and points on the dots and lines of an object and use them to train spatial imagination.
GeoGebra Graphing Calculator Highlights:
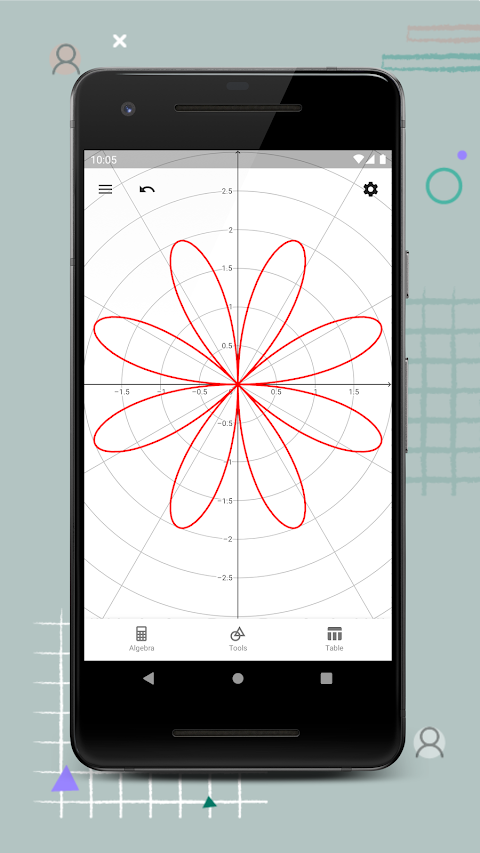
- Plotting functions, polar coordinates, and parametric curves
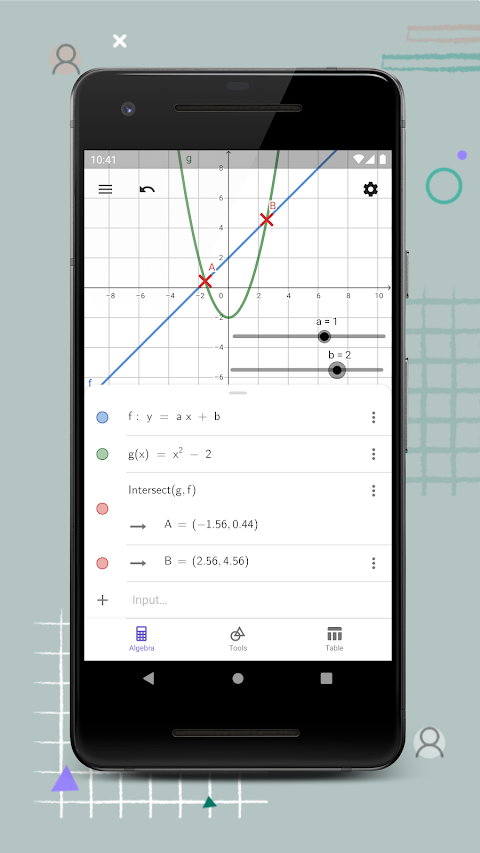
- Experiencing Transformations with Sliders
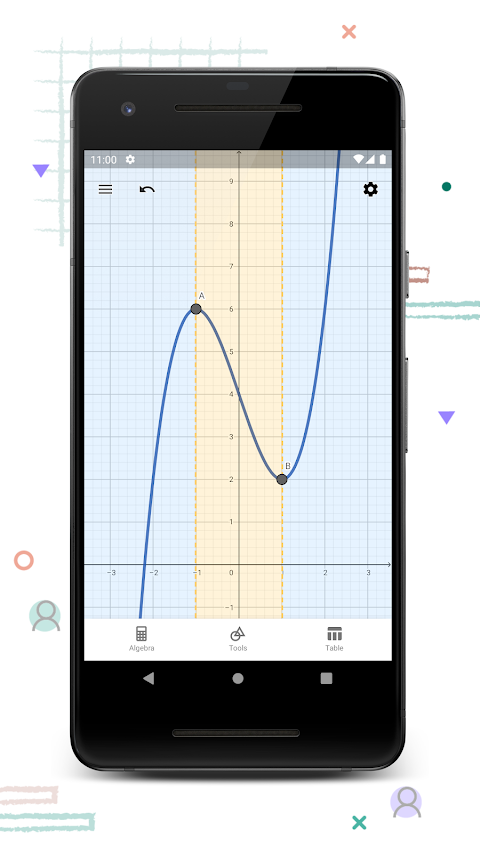
- Getting the special points of a function: roots, minima, maxima, intersections
- Regression with a line of best-fit
- Search for free learning events directly from our app
- Save and share your results with friends and teachers
GeoGebra Graphing Calculator Basic Functions:
- Symbolic computation: supports algebraic symbolic computation, which can simplify expressions, solve equations, and so on.
- Plotting parametric curves: supports plotting curves defined by parametric equations.
- Graphical transformations: Geometric transformations such as translation, rotation, scaling, and other operations are supported.
- Histograms and probability distributions: support for statistical charts such as histograms and probability density functions.
GeoGebra Graphing Calculator Advanced Functions:
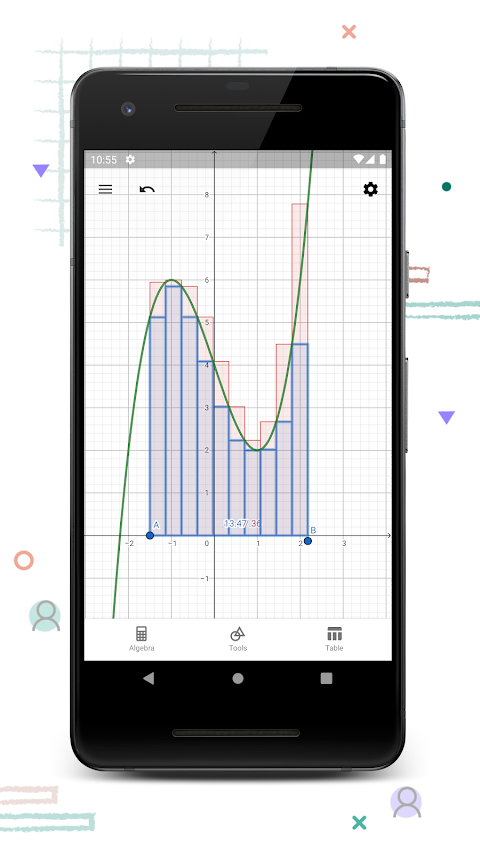
- Calculus Calculator: Supports calculus operations such as derivatives and integrals, and displays the results directly in the graph.
- Dynamic Geometry: By moving elements in the drawing, changes in geometric properties can be observed dynamically.
- Equations are linked to graphs: graphs are updated in real-time as equations are entered, helping to understand the relationship between functions and graphs.
- Statistical regression: supports statistical regression analysis and plotting of fitted curves.
- Text Tool: Allows insertion of text annotations on graphs to illustrate graphs or expressions.
- Geometric Proofs: Supports the construction of geometric proofs and demonstrates the proof process with moving pictures.
GeoGebra Graphing Calculator Features:
- Zoom and navigation features: support for zooming in and out of graphics for easy viewing of details.
- Online Collaboration: Supports multiple people to collaborate and share graphics online at the same time, facilitating team learning and discussion.
- Activity and task library: a large library of built-in math activities and tasks for teachers to use in the classroom.

